This article was originally published on the Pulumi blog.
When using the Pulumi Automation API to create applications which can provision infrastructure, it is very handy to be able to use observability techniques to ensure the application functions correctly and to help see where performance bottlenecks are.
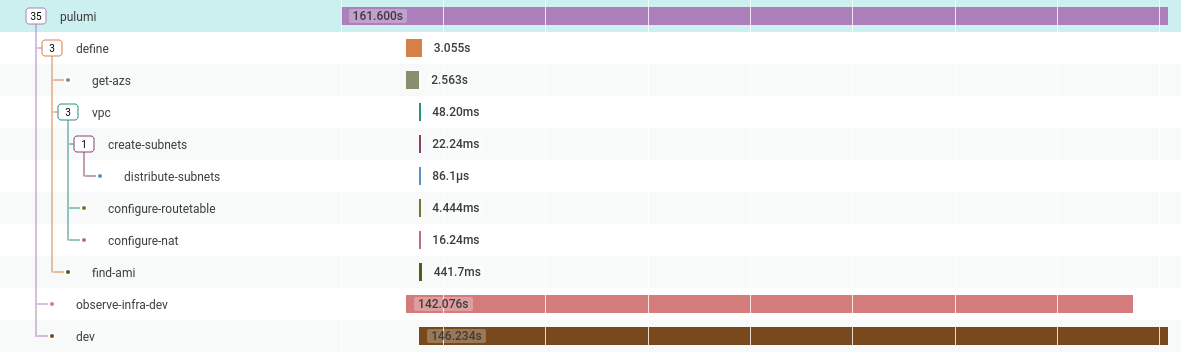
One of the applications I work on creates a VPC and Bastion host and then stores the credentials into a Vault instance. The problem is that the “create infrastructure” part is an opaque blob, in that I can see it takes 129 seconds to create, but I can’t see what it’s doing, or why it takes this amount of time.
So can I do better?
The Initial Application
In this example I use Honeycomb’s Go Beeline to capture all the data I care about; durations, errors, any context which is “interesting”:
func main() {

	beeline.Init(beeline.Config{
		WriteKey: os.Getenv("HONEYCOMB_API_KEY"),
		Dataset:  "pulumi-demo",
	})
	defer beeline.Close()

	ctx, span := beeline.StartSpan(context.Background(), "basic-vpc")
	defer span.Send()

	name := auto.FullyQualifiedStackName(os.Getenv("PULUMI_USERNAME"), "basic-vpc", "dev")
	stack, err := auto.UpsertStackInlineSource(ctx, name, "basic-vpc", func(pc *pulumi.Context) error {

		azs, err := getAvailabilityZones(ctx)
		if err != nil {
			beeline.AddField(ctx, "err", err)
			return err
		}

		v, err := vpc.NewVpc(ctx, pc, "dev", &vpc.VpcArgs{
			Description:           "dev",
			BaseCidr:              "192.168.0.0/16",
			AvailabilityZoneNames: azs,
			S3Endpoint:            true,
			DynamoEndpoint:        true,
		})
		if err != nil {
			beeline.AddField(ctx, "err", err)
			return err
		}
	})

	if err != nil {
		beeline.AddField(ctx, "err", err)
		os.Exit(1)
	}

	if err := stack.SetConfig(ctx, "aws:region", auto.ConfigValue{Value: os.Getenv("PULUMI_REGION")}); err != nil {
		beeline.AddField(ctx, "err", err)
		os.Exit(1)
	}

	ws := stack.Workspace()
	if err := ws.InstallPlugin(ctx, "aws", "v3.23.0"); err != nil {
		beeline.AddField(ctx, "err", err)
		os.Exit(1)
	}

	if _, err := stack.Refresh(ctx); err != nil {
		beeline.AddField(ctx, "err", err)
		os.Exit(1)
	}

	stream := optup.ProgressStreams(os.Stdout)
	if _, err := stack.Up(ctx, stream); err != nil {
		beeline.AddField(ctx, "err", err)
		os.Exit(1)
	}

	//vault code

}
Adding Infrastructure Observability
To get a handle on what is happening when stack.Up() runs, I have mplemented a custom io.Writer, which will be passed into the ProgressStream constructor.
The custom progress stream’s Write method is called once for each line emitted, which allows us to start new spans when a resource starts being constructed, and send them when construction completes. Currently, this is achieved by parsing the console output text, but I gather in the future, it will be possible to get streamed json blobs which can be unmarshaled into go structs.
type pulumiBeeline struct {
	ctx      context.Context
	contexts map[string]func()
}

func NewPulumiBeeline(ctx context.Context) *pulumiBeeline {
	return &pulumiBeeline{
		ctx:  	ctx,
		contexts: map[string]func(){},
	}
}

func (cw *pulumiBeeline) Write(p []byte) (n int, err error) {

	// todo: make more robust, support modifications, deletions etc.
	line := strings.TrimSpace(string(p))
	parts := strings.Split(line, " ")
	if len(parts) < 5 {
		return len(p), nil
	}

	//+  aws-vpc dev creating
	//+  <type> <name> <action>
	resourceType := parts[2]
	resourceName := parts[3]
	resourceAction := parts[4]

	if resourceAction == "creating" {
		c, s := beeline.StartSpan(cw.ctx, resourceName)
		beeline.AddField(c, "type", resourceType)
		// add other things here

		cw.contexts[resourceName] = s.Send
	}

	if resourceAction == "created" {
		cw.contexts[resourceName]()
	}

	return len(p), nil
}
Modifying the optup.ProgressStreams is the only change needed to the original application:
stream := optup.ProgressStreams(os.Stdout, NewPulumiBeeline(ctx))
if _, err := stack.Up(ctx, stream); err != nil {
	beeline.AddField(ctx, "err", err)
	os.Exit(1)
}
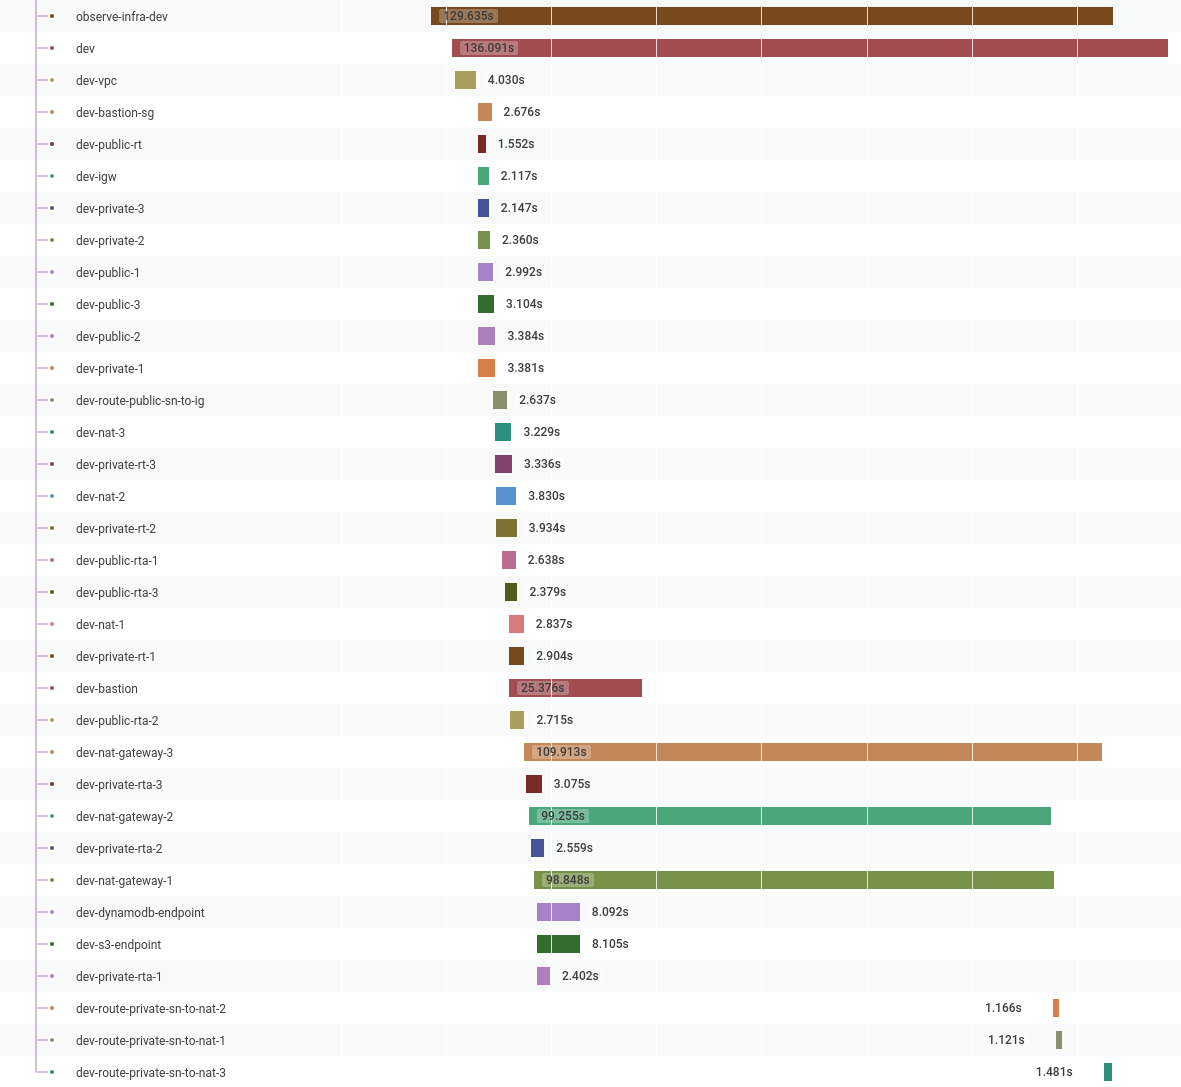
Now when I run this program again, I can see a lot more information in my Honeycomb traces, which not only shows me that Pulumi is highly parallelised, but also gives me a better idea of where the time is taken when creating infrastructure; in this example, it’s the NAT Gateways:
In the future, I want to expand this to cover far more details, such as including the reasons resources were created/modified/destroyed and including as much information as possible about what caused a resource to fail.
Wrapping Up
In the end, this turned out to be much easier to achieve than I had hoped. Being able to use Pulumi progmatically, rather than running os.Exec directly myself was a huge productivity boost.
I am looking forward to all the new kinds of tooling I can build to solve my user’s problems continuing to utilise Honeycomb for my observability and Pulumi for my infrastructure.