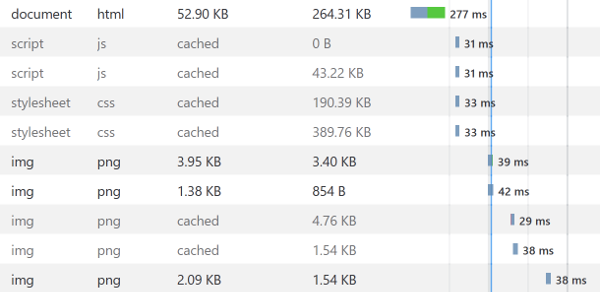
I wanted to show request charts (similar to the network tab in firefox) for requests across our microservices but wanted to do so in the least invasive way possible.
We already use LogStash to collect logs from multiple hosts (via FileBeat) and forward them on to ElasticSearch, so perhaps I can do something to also output from LogStash to a tracing service.
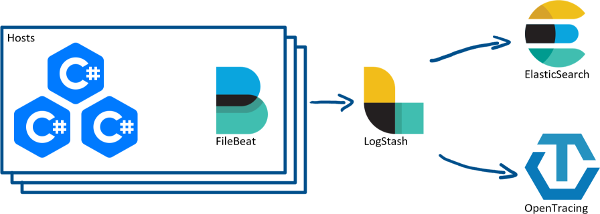
There are a number of tracing services available (AppDash, Jaeger, Zipkin), but unfortunately LogStash doesn’t have plugins for any of them or for OpenTracing. I picked Jaeger, as it seemed to be the easiest to get up and running, and also had a “Zipkin compatible” API too if you didn’t want to use the Jaeger one.
Setting up and running Jaeger in a production environment is way out of scope for this post, but for testing, I am just using the all-in-one Docker container:
docker run -d --nameron jaeger \
  -e COLLECTOR_ZIPKIN_HTTP_PORT=9411 \
  -p 5775:5775/udp \
  -p 6831:6831/udp \
  -p 6832:6832/udp \
  -p 5778:5778 \
  -p 16686:16686 \
  -p 14268:14268 \
  -p 9411:9411 \
  jaegertracing/all-in-one
The tracing APIs work in roughly the same way: all traces have the same traceid, and are sub-divided into spans. Spans have a unique id and can have a parent (span) id set. The trouble with sending data from LogStash is that I don’t have any parent IDs available. Well, at least without going and adding it to all our applications, and I’m not sure how I would want to propagate it correctly either.
So the first question is: can I push multiple spans without any parent IDs, and have it plot them as I would expect.
Is span.parentid required?
As the HTTP API documentation seems to be non-existent (other than “there is one!”), and most of the other docs mention the Thrift API, I decided to use that to test the theory. The Jaeger C# client library has a nice API to use, but I wanted to manually specify things (e.g. traceid, spanid, etc.) and the API has no way to do that, as pretty much everything is marked as internal.
Instead, I cloned the client repository, and added a test (which had access to all the internals I wanted):
public class Scratch
{
    private readonly HttpSender _sender;
    private readonly Tracer _tracer;
    private readonly TraceId _id;

    public Scratch(ITestOutputHelper output)
    {
        _sender = new HttpSender("http://localhost:14268/api/traces");
        _tracer = new Tracer.Builder("FirstService").Build();
        _id = TraceId.NewUniqueId(false);

        output.WriteLine(_id.ToString());
    }

    [Fact]
    public async Task Send()
    {
        var start = DateTime.UtcNow;

        await Create(start, start.AddSeconds(5));
        await Create(start, start.AddSeconds(3));

        await Create(start.AddSeconds(5), start.AddSeconds(10));
        await Create(start.AddSeconds(10), start.AddSeconds(20));
        await Create(start, start.AddSeconds(20));

        await _sender.FlushAsync(CancellationToken.None);
    }

    private async Task Create(DateTime start, DateTimeOffset finish)
    {
        var context = new SpanContext(_id, SpanId.NewUniqueId(), new SpanId(0), SpanContextFlags.None);
        var span = new Span(_tracer, "test", context, start, new Dictionary<string, object>(), null);
        span.Finish(finish);

        await _sender.AppendAsync(span, CancellationToken.None);
    }
}
The graph rendered how I hoped, proving that I don’t need to set the span’s parentid for everything with the same traceid to work correctly!
How to generate a consistent TraceID?
All our services pass along or generate a correlationID for each request, so my idea here was to do some conversion to put it in the traceid, which is an int64. Our correlationIDs are guids, which internally is an int128, so I figured I would take the least significant 8 bytes and use that. This can be done in C# like so:
var correlationID = Guid.NewGuid();
var traceID = new TraceId(BitConverter.ToInt64(correlationID.ToByteArray(), 8));
I noticed, however, that the TraceID structure in the Jaeger client can take two values: int64 low and int64 high, so I can use the entire correlationid.
How to ship from LogStash?
After reading through the LogStash Output Plugins docs it looked like there were three possible ways to ship the events to Jaeger: writing a command line app; invoked through either exec or pipe, writing a LogStash plugin, or doing something with the http output.
CLI adaptor
The idea of this method would be to write a CLI app which takes an event from LogStash and then sends it to Jaeger using the Thrift API. The app itself could be invoked using the exec or pipe outputs. I didn’t want to use this method for a few reasons:
Development: The Jaeger client has things I need hidden from the public surface, such as being able to specify the traceid, rather than generating a new one each time, so I would either have to reimplement the classes I need, use reflection to instantiate things, or try opening Pull Requests to expose more internals of the library.
Maintenance: I’d rather not have yet another thing to maintain if I can avoid it, not to mention all the additional things like repository location, build agents, etc.
Deployment: Our LogStash box is a plain Ubuntu box with nothing other than Java and LogStash installed on it. As I would probably end up using C# to write the app, I’d need to add even more dependencies.
Throughput: Jaeger (and the others) support sending traces in batches for better efficiency. Writing an app which supported that would involve writing the batching and caching, and the likelihood is I would mess it up, and increase the chances of lost messages.
LogStash plugin
Basically has the same problems as above, with the addition of me needing to learn enough about Java to build something reliable, and as this is a test and no one else in my team really knows Java either, so I ruled this out.
Http?
The Jaeger collector process can also expose a Zipkin compatible API, and while the documentation for that API is also terrible, I was able to find a Pull Request on Github with some structure defined. I figured I could do most of this directly with LogStash’s configuration DSL, assuming I can: generate a uuid (logstash-filter-uuid plugin), and remove all extra stuff from the post body (logstash-filter-prune).
Building the LogStash message
The first step of my configuration is based on what we need to do to Serilog messages to make them a bit nicer in Kibana:
Pre-processing
json {
    source => "message"
}

date {
    match => [ "Timestamp", "ISO8601", "yyyy-MM-dd'T'HH:mm:ss.SSSSSSSZZ"]
    target => "@timestamp"
}

mutate {
    rename => {
        "[Properties][ApplicationName]" => "ApplicationName"
        "[Properties][CorrelationId]" => "CorrelationId"
        "[Properties][SourceContext]" => "Context"
        "[Properties][TimedOperationElapsedInMs]" => "TimeElapsed"
    }
}
The json block tells LogStash that everything in the message property is a json object, rather than a string.
The date block extracts the time the message was recorded by the application and writes it to the special @timestamp field. This is a good idea as due to queuing, and processing times, the time the message was written and the time it was processed by LogStash will be different.
Lastly, the mutate block is moving a bunch of fields out of the message properties, and up to the top level of the object. We query by things like ApplicationName a lot, and it’s nice not to have to write Properties.ApplicationName:blahblah all the time.
Splitting
Our messages contain a lot of data which for the purposes of tracing, we just don’t care about. Not only is it a waste of bandwidth to send all the data to Jaeger, but also there could be clashing fields, and if we ever decide to use a hosted version of Jaeger, I don’t want to be sending them all the data either.
So how do we remove everything from the message, but still keep it in the message for the other outputs?
LogStash has an interesting filter called clone. What it does is copy the message as many times as you specify, and then runs the remaining part of the pipeline once per message, including the original message. In code, this just looks like this:
clone {
    clones => [ "jaeger" ]
}
If we wanted to split the message more times, we can just add more types to the clones array; there will be one extra message produced for each entry in the array, which will also be added to the message as the type property so we can filter on it later.
We don’t want to send the type field itself to Jaeger (or ElasticSeach), so we move it from the message to the @metadata object, which doesn’t get passed to outputs.
mutate {
    rename => { "type" => "[@metadata][type]" }
}
To handle the messages differently, we can just use an if statement on the @metadata.type property:
if [@metadata][type] == "jaeger" {
    # do stuff to the jaeger message
} else {
    # process the original message
}
Building the Http Payload
The hardest part of getting this to work was handling the dates. Jaeger specifies that timestamps should come in microseconds since epoch, and duration should be in microseconds also. We need to use the ruby filter so we can run some code to do this, rather than using an inbuilt filter primitive.
The duration is easy enough, as we report TimeElapsed in milliseconds:
ruby {
    code => "event.set('duration', (event.get('TimeElapsed') * 1000).floor)"
}
To handle the timestamp we need to convert it to epoch milliseconds. We can get the fractional seconds since the epoch by calling to_f on the @timestamp field, and then multiply by 1000 a couple of times to express it as microseconds. We also floor it to remove the leftover fraction:
ruby {
    code => "event.set('timestamp', (event.get('@timestamp').to_f * 1000 * 1000).floor)"
}
This on its own will work, but it won’t be right. We report log entries when an operation completes, which means our timestamp is the finish of the event, not the start. To solve this, we subtract the duration off the timestamp:
ruby {
    code => "event.set('timestamp', (event.get('@timestamp').to_f * 1000 * 1000).floor - event.get('duration'))"
}
Next, we need to create our span id. We need to generate a random id, consisting of letters and numbers, so the easiest way is to generate a uuid, and then tweak it to fit the Jaeger/Zipkin format. To do that we need to install the logstash-filter-uuid plugin:
/usr/share/logstash/bin/logstash-plugin install logstash-filter-uuid
There are a few things we need to do to generate a valid span id (for Jaeger):
- generate a uuid
- remove the dashes
- make it lowercase
- trim it to 16 chars
We use four filters to achieve this:
uuid {
    target => "id"
}
mutate {
    gsub => [ "id", "-", "" ]
    lowercase => [ "id" ]
}
mutate {
    gsub => [ "id", "(^.{1,16}).*$", "\1"]
}
The reason we specify the mutate twice is that order of the same operation (gsub in this case) is not guaranteed within a mutate block.
Next up we need to tweak the traceid from a guid to a uuid:
mutate {
    gsub => [ "traceid", "-", "" ]
    lowercase => [ "traceid" ]
}
Next, we can populate some other context into the message, by renaming the other fields we want. I discovered most of the fields and their formats from a combination of the thrift dtos and the this pull request.
mutate {
    rename => {
        "CorrelationId" => "traceid"
        "Context" => "name"
        "ApplicationName" => "[localEndpoint][serviceName]"
    }
}
Finally, we want to trim all the other properties from our message, which we can do by using the logstash-filter-prune plugin:
prune {
    whitelist_names => [ "id", "traceid", "name", "timestamp", "duration", "localEndpoint" ]
}
mutate {
    remove_field => [ "@timestamp" ]
}
We have to explicitly remove the @timestamp property as the prune plugin seems to ignore it (it also ignores the @metadata property).
The complete filter code can be made a little more efficient by combining several of the mutate blocks, provided we keep things in the right order, as follows:
ruby {
    code => "event.set('duration', (event.get('TimeElapsed') * 1000).floor)"
}

ruby {
    code => "event.set('timestamp', (event.get('@timestamp').to_f * 1000 * 1000).floor - event.get('duration'))"
}

uuid {
    target => "id"
}

mutate {
    rename => {
        "CorrelationId" => "traceid"
        "Context" => "name"
        "ApplicationName" => "[localEndpoint][serviceName]"
    }
    remove_field => [ "@timestamp" ]
}

mutate {
    gsub => [ "id", "-", "" ]
    gsub => [ "traceid", "-", "" ]
    lowercase => [ "traceid", "id" ]
}

mutate {
    gsub => [ "id", "(^.{1,16}).*$", "\1"]
}

prune {
    whitelist_names => [ "id", "traceid", "name", "timestamp", "duration", "localEndpoint" ]
}
Publishing to Jaeger
When publishing to the Jaeger API, you have to send it an array of json objects. To achieve this in the http output plugin, we can enable the format => json_batch, which will cause the HTTP client to buffer some events and then send them all at once. So more efficiency, and no extra code on our part.
To help make testing easier, I publish to two different HTTP endpoints: the Jaeger docker container running on my host machine, and to a Request Logger Bin; where I can inspect the response if something is reported as a failure by Jaeger, and replay it (via the Insomnia REST client) and check error messages returned from Jaeger.
output {
    if [@metadata][type] == "jaeger" {
        http {
            url => "http://192.168.0.115:9411/api/v2/spans"
            format => "json_batch"
            http_method => "post"
        }

        http {
            url => "http://requestloggerbin.herokuapp.com/bin/ff3da5b2-ec57-4611-ada8-b360ab38830c"
            format => "json_batch"
            http_method => "post"
        }
    } else {
        # normal message handling: elasticsearch etc.
        stdout { codec => rubydebug }
    }
}
I also used LogStash’s log output by tailing the log file:
tail -f /var/log/logstash/logstash-plain.log
Eventually, I had a working LogStash configuration and can view application traces in Jaeger.
Problems
One thing I cannot figure out how to do is sending the tags property to Jaeger. The Zipkin (and OpenTracing) APIs specify tags to be an object, e.g.
{
  "traceid": "1ee98d32185e41faba146c151ce8e27d",
  "id": "8377a6dae87947d7",
  "timestamp": 1545321238784000,
  "duration": 409000,
  "localEndpoint": { "serviceName": "PersonInformationService" },
  "name": "SomeOperation",
  "tags": {
    "CorrelationID": "1ee98d32-185e-41fa-ba14-6c151ce8e27d",
    "db.name": "test-blahblah"
  }
}
But LogStash wants the tags property to be an array of strings, and even using the remove_field on tags and then manually populating it doesn’t work. Currently, I don’t need anything in the tags, but it would be nice to have it working. I should ask on the Elastic forums perhaps.
Wrapping Up
This post turned out to be a lot longer than I was expecting, but hopefully, it was interesting. Next time I’ll try and go through how I do testing of immutable infrastructure, as well as local development of the base images.