Tracking where the time goes in your CI pipeline is an important step towards being able to make it go even faster. Up until somewhat recently, the only way of tracking how long tasks took in CI was either hoping people had wrapped all their commands in time ..., or by reading a timestamped build log and calculating the difference between numbers. Which isn’t great or fun, if we’re being honest.
What if we could create graphs of what parts of the build took time? Something like this?
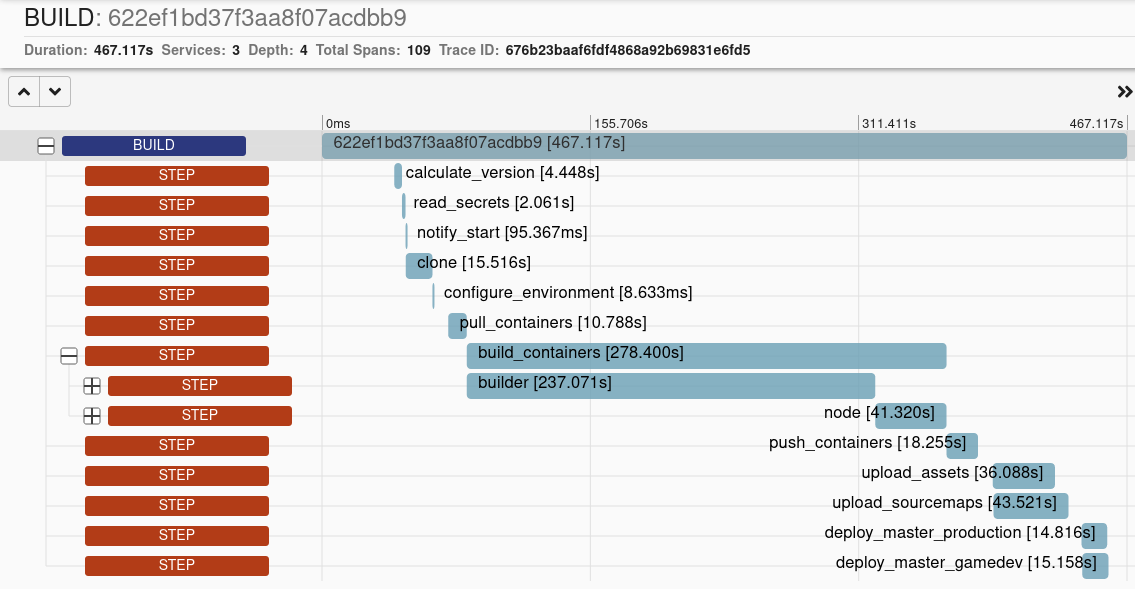
Being someone who cares about build pipelines and speed, I decided to add OpenTelemetry to our builds, and see what information we could get. It turns out that there is far more useful information available than just timings. For example:
- number of main builds; are we merging often? is this speeding up or slowing down?
- number commits merged to
mainat once; is our batch size going up? why? - deployments per day; are we still moving fast? Are people scared to deploy on Friday? why?
- pass and failure ratios; are failures becoming more often? why?
- runtime of failed builds; failing builds should be fast, so we re-ordered steps so that likely failures are hit first
- what fails most often?; a test suite testing too much? flaky tests? a dependency not being locally cached (and thus unavailable sometimes)?
Terminology
The OTEL website has details on what all the terminology means, but for a brief summary:
- span: the basic units which make up a trace. They can be parented to other spans and can represent the entire build, a logical grouping of operations, or a single operation.
- trace: a collection of spans with one “root span” which has no parent.
- attributes: key-value pairs attached to spans to provide more context.
- [Otel Collector][otel-collector] - a service which accepts traces in a variety of formats and can forward them to other places. Generally, you run one of these locally and all applications send to it, and it is configured to batch, enrich, and forward to a tracing service, such as Honeycomb or Jaeger
Tracing Builds
The first step when tracing builds is to start with the overall picture: one span for the entire build. Once this is in place, you can move on to adding details, focusing your efforts on figuring out what is the most likely place to find speed improvements.
To do this, I use the trace tool, which is an opinionated CLI that creates OTEL traces for your build pipeline. If you need more flexibility or don’t like its opinions, you can either open a PR/Issue on Github, or there is the otel-cli which is much more low-level.
The trace command will send spans to localhost:4317 by default. By setting the OTEL_EXPORTER_OTLP_ENDPOINT environment variable, our traces will instead go to our local [OTEL Collector][otel-collector] instance, which is configured to send our traces elsewhere:
Install the trace tool:
env:
  OTEL_EXPORTER_OTLP_ENDPOINT: https://otel.internal.xyz:443

jobs:
  build:
    runs-on: ubuntu-latest

    steps:
    - name: Setup Trace
      uses: pondidum/trace@main
      with:
        version: "0.0.9"
export OTEL_EXPORTER_OTLP_ENDPOINT=https://otel.internal.xyz:443
version="0.0.9"

curl -sSL "https://github.com/Pondidum/trace/releases/download/${version}/trace" -o /usr/bin/trace
chmod +x /usr/bin/trace
Now we can start the trace; by default this will be marked as starting when the trace start command is run; we can change this with the --when flag, which is being fed the created_at field from Github so that our trace shows when the build was started.
    - name: Start Trace
      uses: pondidum/trace/start@main
json=$(curl -sSL \
  --url "${GITHUB_API_URL}/repos/${GITHUB_REPOSITORY}/actions/runs/${GITHUB_RUN_ID}/attempts/${GITHUB_RUN_ATTEMPT}" \
  -H "Accept: application/vnd.github+json" \
  -H "Authorization: Bearer ${GITHUB_TOKEN}" \
  -H "X-GitHub-Api-Version: 2022-11-28")

created_at=$(echo "$json" | sed -n 's/.*"created_at".*"\(.*\)".*/\1/p')
trace_parent=$(trace start "${GITHUB_REPOSITORY}/${GITHUB_WORKFLOW}" --when "${created_at}")
export "TRACEPARENT=${trace_parent}"
So that we can capture the overhead of the build job starting and the first build command running, we also store the current time as an attribute:
trace attr "first_command" $(date +%s)
At the end of the build, we finish the trace - this needs to happen no matter how the build finishes, pass or failure.
    - name: Finish Trace
      if: always()
      uses: pondidum/trace/finish@main
By using if: always(), we make sure this step runs no matter if the workflow was failed, cancelled or success.
The action uses the {{ job.status }} context to add the --error flag and a message with the status in it, if the job doesn’t pass.
trap '
    rc=$?; # store the exit code
    [ $rc = "0" ] && echo trace finish ${TRACEPARENT}
    [ $rc != "0" ] && echo trace finish --error="exit ${rc}"
    trap - EXIT;
    exit
  ' EXIT INT HUP
By using a trap, we can make sure the ./trace finish command always runs regardless of how the script was killed. This needs to be written near the top of the script however!
Tracing Build Steps
Now that there is a trace for the entire build, we can start adding more details.
For example, we might want to pull a few docker containers so that we have warm caches, and want to keep track of how long this takes:
group=$(trace group start "docker_pull")

  trace task -- docker pull app:builder || true
  trace task -- docker pull app:latest || true
  trace task -- docker pull alpine:3.18 || true

trace group finish "${group}"
Tracing and Feature Flags
When you are using feature flags in your CI system, adding their state to the trace is important; it allows us to filter traces by what flags were active on a given run, letting us see if a particular flag has an impact on success rate or time taken.
# flagon supports the `TRACEPARENT` environment variable, so you
# also get spans for it querying your flag service too!
vitest=$(flagon state "ci-enable-vitest" "false" \
  --user "${email}" \
  --attr "branch=${branch}" \
  --output "template={{.Value}}" || true)

trace attr "enable_vitest=${vitest}"

# later


group=$(trace group start "testing")

  if [ "${vitest}" = "true" ]; then
    pnpm run vitest
  else
    pnpm run jest
  fi

trace group finish "${group}"
This will give us a trace with the enable-vitest flag state, and we can group by this to see if vitest is faster than jest and what effect it had on test count etc.